

目次
翻訳クォータ
画面上部には翻訳クォータが表示されます。画面左側には、Google Cloud AI翻訳クォータ(月間または年間メンバーシップ)が表示されます。画面右側には、 Linguise AI翻訳クォータ(翻訳品質向上のためにメンバーシップに追加したプリペイドAIクォータ)が表示されます。.
過去30日間の翻訳使用状況
に接続すると、 Linguise ダッシュボード 選択したドメインに関連する統計情報が表示されるダッシュボードにリダイレクトされます。
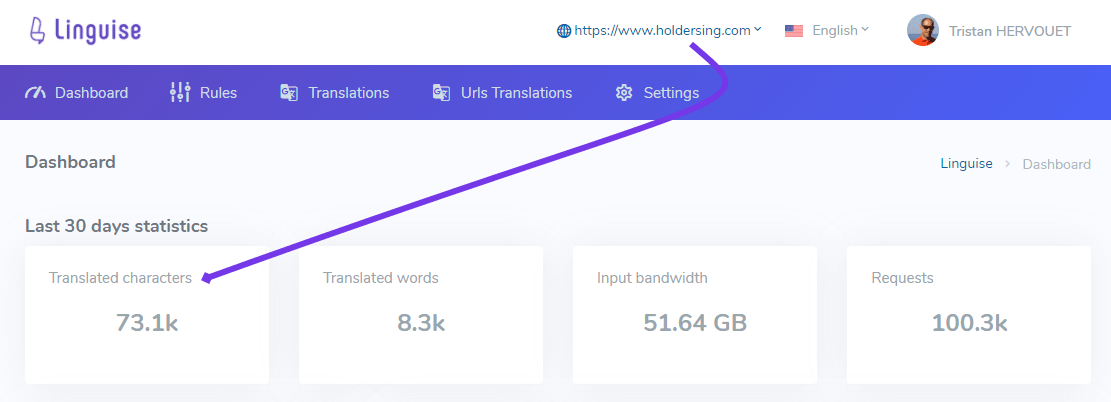
最初に表示される統計は次のとおりです。
- 翻訳された単語数
- 帯域幅: クライアントに転送される多言語データの量
- 多言語ページの読み込みリクエストの総数
言語別のページビュー
次のダッシュボード統計ブロックは、言語別のページビュー上位 10 件です。.
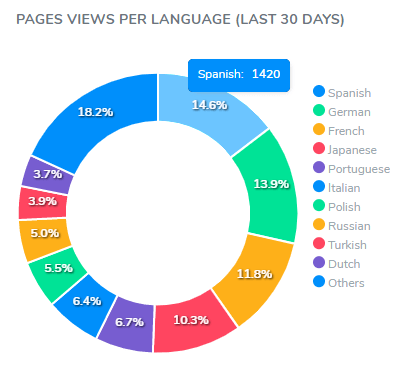
その横には、多言語 (のみ) のページビューが 30 件表示されます。.
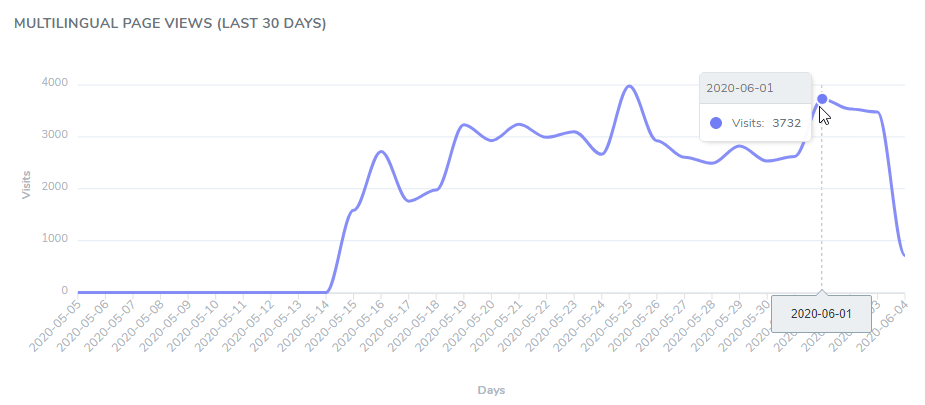
より詳細な多言語統計情報については、Google Analyticsまたはその他のトラフィック統計ツールをご利用ください。Linguise でGoogle Analyticsを使用する方法 Linguise