Table of Contents
Last 30 days translation usage
After your connection to your Linguise dashboard you’ll get redirected to the dashboard with statistics related to the domain selected.

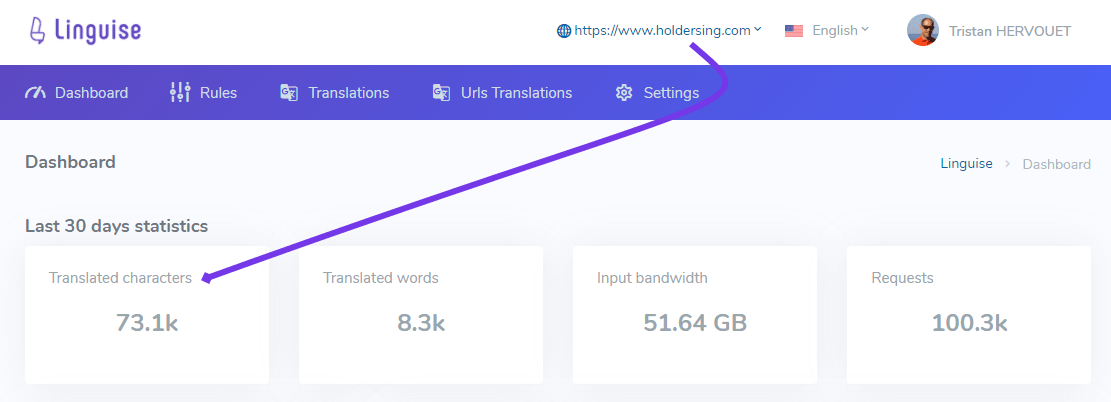
The first statistics you’ll see are:
- The number of words translated
- The bandwidth: volume of multilingual data transferred to clients
- The total number of request to load multilingual pages
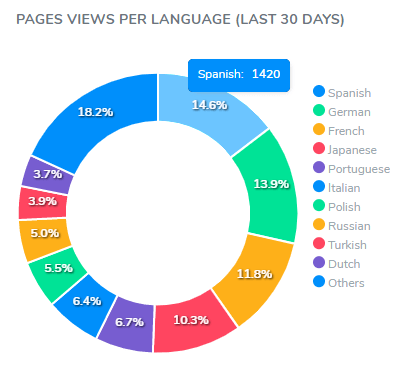
Page views by languages
The next dashboard statistic block is the top 10 page views by languages.

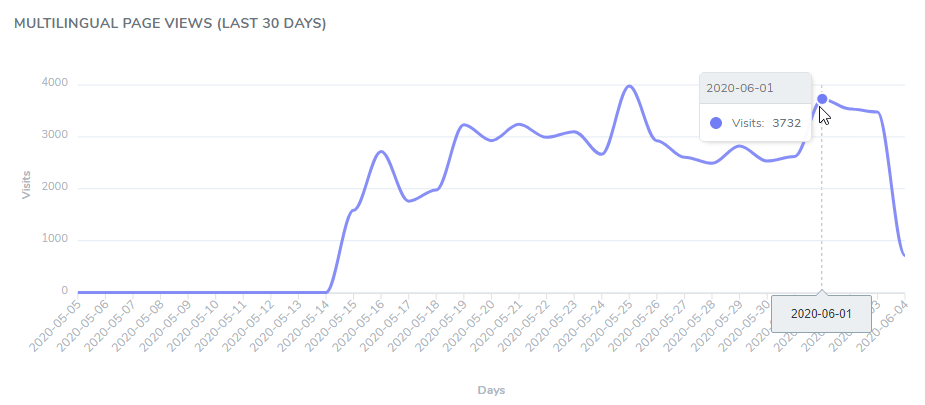
At it’s side you’ll get the 30 multilingual (only) pages views.

For more detailed multilingual statistics you can use Google Analytics or any other traffic statistic tool. Learn more about how to use Google Analytics with Linguise
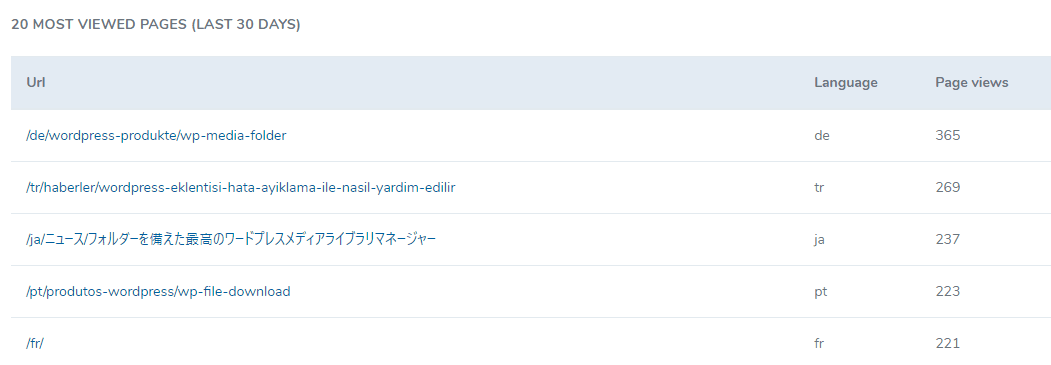
20 most visited multilingual pages
At the bottom of the dashboard you’ll get statistics about the most viewed pages by language, during the latest 30 days. Page views represent the number of multilingual pages loaded, excluding automatic visit by crawler robots. Note that this is different from user visits, as one user can load several multilingual pages.
